
SIPOC diagrams are a helpful visual tool for defining the inputs, outputs, and business processes. It also allows team members to identify gaps or improvements in business operations.
The sipoc is a common part of the DMAIC Process Improvement Cycle, which is used to improve a business through continuous improvement and analysis. It also helps teams and sponsors agree on project boundaries and scope, as well as Key Process Input Variables (KVIPs) and Key Process Output Variables (KPOVs).
What Is SIPOC?
The SIPOC Diagram is a simple, easy-to understand visual representation of inputs and out-puts for a particular business process. Its primary function is to aid the team to understand and analyze the process from a high level. It provides a clear picture on the steps necessary to transform the inputs into the desired outputs.
What is history of sipoc diagrams?
The origins of the sipoc diagram can be traced back to the late 1980s, as a part of the total quality management (TQM) approach and Six Sigma model to business process improvement. It has since been widely used in lean-manufacturing and business process improvement programmes, as it's an effective tool for streamlining, identifying improvements, and improving communications between stakeholders.
How to Make SIPOCs
In order to construct a SIPOC chart, the first thing you need to do is choose which business process you would like to analyze. This will help you and your team to focus on the most important areas and ensure that no important details are overlooked.
You will then need to identify what inputs you require to make your process run and who is providing them. You should list each supplier and their contact information, along with the raw materials that they provide to the process.
You can also list both internal clients and external clients that will be receiving the outputs. This can help to ensure that the company is providing high-quality products and services.
Inputs: This is the first section of a SIPOC diagram and includes the material or information specifications that are required by the process. Materials can be tangible goods like products, or they can be informational, such a report.
Outputs is the second part of a SIPOC Diagram. It is usually a list that includes the products, services or actions completed as a result. Outputs should reflect what customers expect and should meet customer needs.
Customers: This is the final section of a SIPOC diagram and identifies the customers that receive the process's outputs, both internal and external to the organization. This can include maintenance teams, line operators and internal and external clients.
SIPOCs are powerful visual tools that can be used for improving business processes and communication among all stakeholders. It's easy to create and is a great way to get team members to understand the business processes that are being examined. It is recommended that you use a diagram template that contains all of the important components, like inputs and out put. You can save both time and energy by using a template.
FAQ
What is the best way to learn about manufacturing?
Practical experience is the best way of learning about manufacturing. You can also read educational videos or take classes if this isn't possible.
What is manufacturing and logistics?
Manufacturing is the act of producing goods from raw materials using machines and processes. Logistics covers all aspects involved in managing supply chains, including procurement and production planning. Manufacturing and logistics can often be grouped together to describe a larger term that covers both the creation of products, and the delivery of them to customers.
Why is logistics so important in manufacturing?
Logistics are an essential component of any business. They are essential to any business's success.
Logistics play an important role in reducing costs as well as increasing efficiency.
Statistics
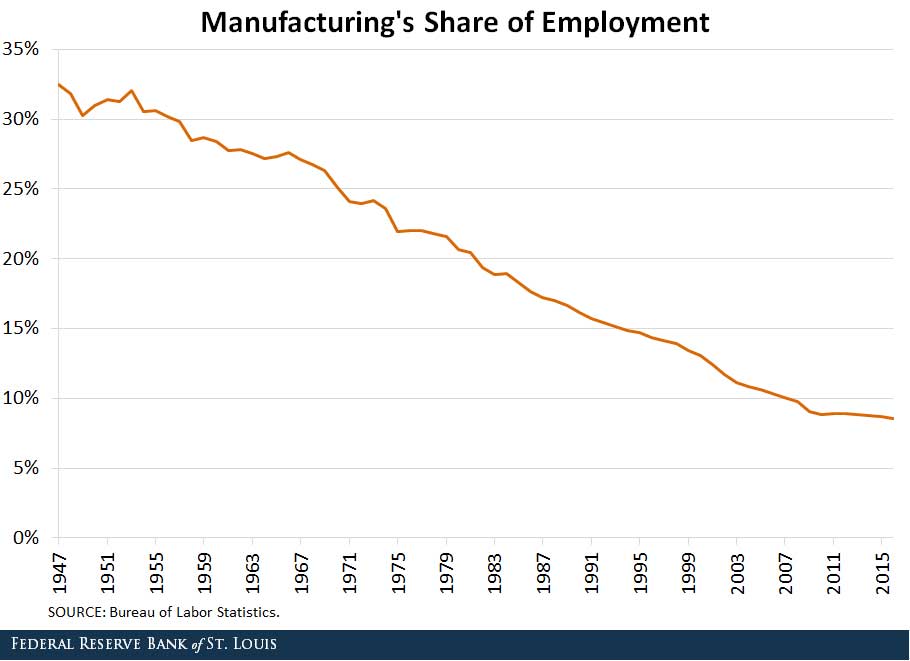
- It's estimated that 10.8% of the U.S. GDP in 2020 was contributed to manufacturing. (investopedia.com)
- In the United States, for example, manufacturing makes up 15% of the economic output. (twi-global.com)
- According to a Statista study, U.S. businesses spent $1.63 trillion on logistics in 2019, moving goods from origin to end user through various supply chain network segments. (netsuite.com)
- Job #1 is delivering the ordered product according to specifications: color, size, brand, and quantity. (netsuite.com)
- Many factories witnessed a 30% increase in output due to the shift to electric motors. (en.wikipedia.org)
External Links
How To
How to Use 5S to Increase Productivity in Manufacturing
5S stands for "Sort", 'Set In Order", 'Standardize', & Separate>. Toyota Motor Corporation created the 5S methodology in 1954. It improves the work environment and helps companies to achieve greater efficiency.
The idea behind standardizing production processes is to make them repeatable and measurable. This means that daily tasks such as cleaning and sorting, storage, packing, labeling, and packaging are possible. Because workers know what they can expect, this helps them perform their jobs more efficiently.
Implementing 5S involves five steps: Sort, Set in Order, Standardize Separate, Store, and Each step is a different action that leads to greater efficiency. For example, when you sort things, you make them easy to find later. When you arrange items, you place them together. Once you have separated your inventory into groups and organized them, you will store these groups in easily accessible containers. Finally, label all containers correctly.
Employees will need to be more critical about their work. Employees should understand why they do the tasks they do, and then decide if there are better ways to accomplish them. To implement the 5S system, employees must acquire new skills and techniques.
The 5S method increases efficiency and morale among employees. They will feel motivated to strive for higher levels of efficiency once they start to see results.